Isio’s Prudence Watch for LGPS (E&W) Funds

The 2025 actuarial valuation of the LGPS (E&W) set new employer contribution rates which came into force on 1 April 2026, covering the next three years.
Since the last valuation in 2022 the funding level of the LGPS has reached record highs, with the aggregate position remaining well above 100% on Isio’s low-risk funding index for the majority of the period between valuations.
This has created a clear opportunity for LGPS Funds to reset employer contributions and reassess risk, while maintaining long-term stability and member security.
Strong funding levels and significant surpluses could support a case for lower contributions and a potential re-balancing of resources between employers and funds, helping to ease pressure on employer budgets, at a time when many LGPS employers are under significant financial strain.
Isio’s Prudence Watch has been developed to look at how this improved funding position has been reflected in contribution-setting. The analysis compares each fund’s contribution rate with Isio’s standardised low-risk contribution measure, helping employers and funds understand how much caution is being applied.
We have also considered this analysis for employers of the LGPS, which can be accessed here:
What does the analysis show following the 2026 LGPS valuation?
The significant funding improvements have led many Funds to reduce employer contributions from April 2026 bringing the overall average down to 16% of pay.
But beneath this average lies a wide range, with contributions ranging from as low as 1% to as high as 24%. Without greater transparency, it’s hard to understand the reasons behind this range. For example, there is no consistent link between the underlying discount rate assumption used and the level of contributions being paid.
A Fund’s actuary appears to be one determinant in the resulting contribution rates and the combination of factors across Funds contributes to creating a “postcode lottery” for employers, where we can see some employers in neighbouring areas being asked to pay very different rates.
Even at 16%, the average contributions are still well above an average “low-risk” contribution level of 9%, which assumes surplus is used over 20 years. This suggests that employers could still be paying significantly more than they need to over the next three years, even if balanced with security of benefits for members in the fund.
Isio’s analysis shows that Funds have an average Prudence Watch Score of -0.6%, meaning that the effective assumed investment returns are 0.6% below government bond yields. This ranges from a low of 1.5% below government bonds, to a high of 0.3% above government bonds. This could be seen as a very cautious position given the long-term growth assets typically held by LGPS Funds.
Contribution rates
The chart below summarises the fund level contributions for each of the Funds in the LGPS (E&W).
Fund contributions from 1 April 2026
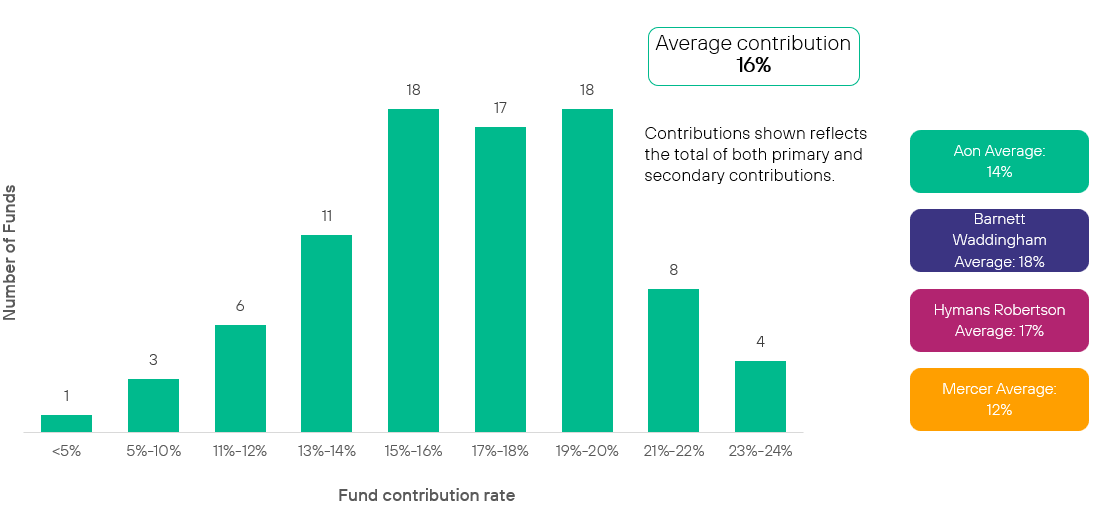
Source: Isio analysis based on the 86 funds in the LGPS (E&W). We have excluded the Environment Agency closed Fund.
There is a large range of contributions across the Funds, with the lowest contribution rate of 1% and the highest of 24%.
The average contribution rate across all Funds is 16% (weighted by the Fund’s payroll). We also show the average for each of the actuarial firms that advise the LGPS Funds.
Comparing contributions rates across Funds is a good start but it doesn’t tell the whole story. For example, Funds could be paying less because they are better funded, or because the Fund is taking a different valuation approach. We consider this in more detail using Isio’s Prudence Watch.
Fund contribution rates from 1 April 2026
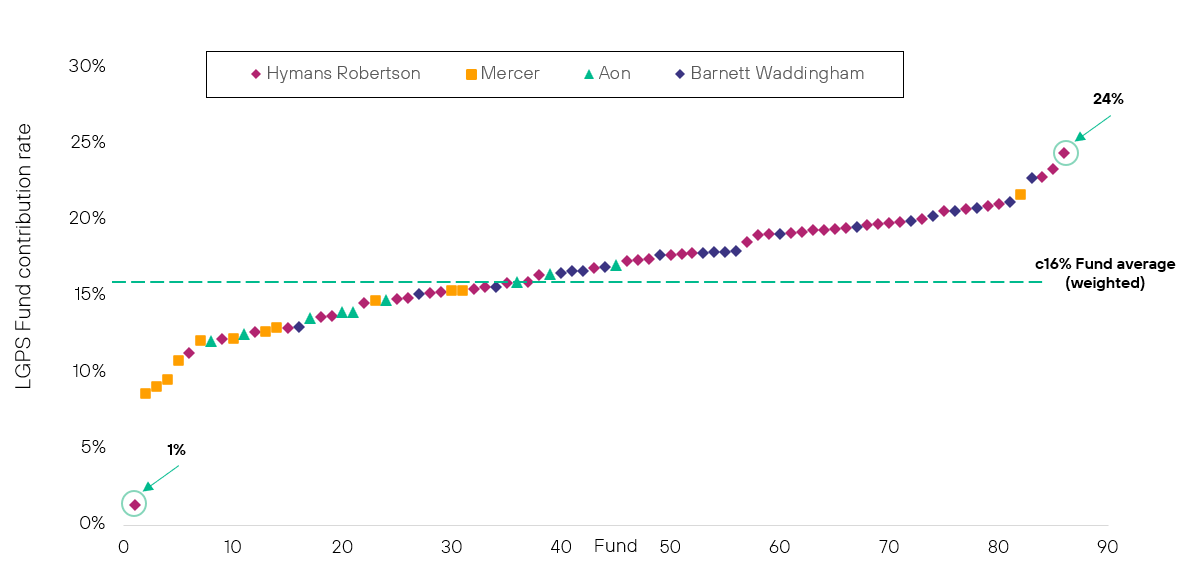
Source: Isio analysis based on the 86 funds in the LGPS (E&W). We have excluded the Environment Agency closed Fund.
The chart above plots the 86 open Funds in the LGPS (E&W) in order of the contributions they are paying.
It shows Funds advised by Mercer and Aon are generally paying lower contributions than those advised by Hymans Robertson and Barnett Waddingham.
Find out where your Fund’s contributions sit compared to others:
Without more detail, it’s difficult to see why contributions vary so much. The lack of transparency in how each Fund sets their rates makes comparisons difficult and raises several questions:
- Why is there such a wide variation between Funds, and even sometimes within the same fund for different types of employers?
- How cautious are Funds being when setting contributions, and how does this compare to their approach at the last valuation? Can this be compared across Funds?
- Over 20 Funds are still asking for extra secondary contributions despite their valuation position showing them being fully funded. Of these, 13 are more than 120% funded and still require additional secondary contributions. What is driving this, and why are these contributions needed?
Focus on primary contribution rates
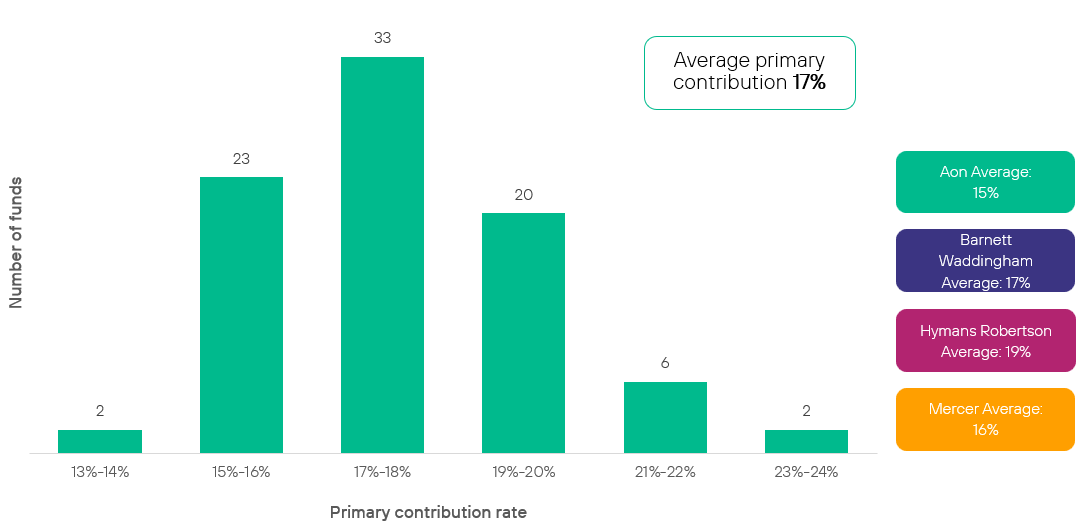
Source: Isio analysis based on the 86 funds in the LGPS (E&W). We have excluded the Environment Agency closed Fund.
The chart shows the distribution of primary rate contributions which cover the cost of new benefits building up over the next year.
Primary contributions range from 14% to 24%.
The average contribution rate across all Funds is 17% (weighted by the Fund’s payroll).
Fund primary contribution rates from 1 April 2026
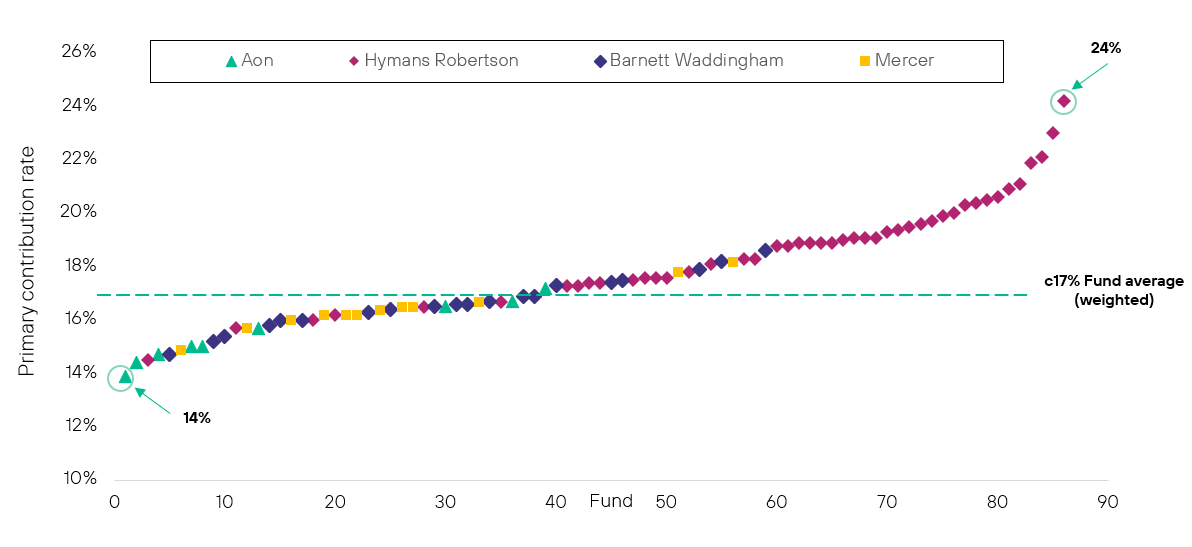
Source: Isio analysis based on the 86 funds in the LGPS (E&W). We have excluded the Environment Agency closed Fund.
The chart above plots the 86 Funds in the LGPS (E&W) in order of their primary contribution rate.
As expected, there is less variation when looking only at the primary rate, but differences remain.
Find out where your Fund’s contributions sit compared to others:
The chart shows a trend where Funds advised by Hymans Robertson tend to have higher primary rates than others.
However, Hymans Robertson’s published assumptions are generally less cautious overall, with a higher average discount rate (5.8% compared to around 5% for others).
This raises the question – if the core assumptions are less cautious, what is driving the higher primary rates? Where is the extra prudence coming from?
Like-for-like comparison – Prudence Watch
Isio’s tool for comparing and assessing the contribution rates.
Low-risk contribution rate – how do the Fund’s contributions compare to Isio’s low -risk measure?
For each Fund our analysis estimates what the Fund’s total contributions would be on a “low-risk” basis. We then look at how this compares to the Fund’s rate for the year from 1 April 2026. The difference illustrates the level of prudence within the proposed contribution approach which can be compared with other Funds.
The low-risk contribution rate is estimated based on a ‘low-risk’ basis whereby the discount rate has been set with reference to long dated UK Government bond yields as a reference point to enable consistency across all LGPS Funds. The total low-risk contribution rate reflects the cost of new benefits building up with an allowance for any low-risk surplus or deficit spread over 20 years used to reduce or increase contributions.
Further details can be found in the Appendix.

Contributions above the low-risk contribution rate reflect the additional prudence the fund is taking.
A higher difference reflects higher prudence.
For each Fund, the chart below shows the difference between the low-risk contribution rate and the Fund’s contribution rate.
We have shown how this compares by actuarial firm below.
Low-risk contributions – how do Funds compare?
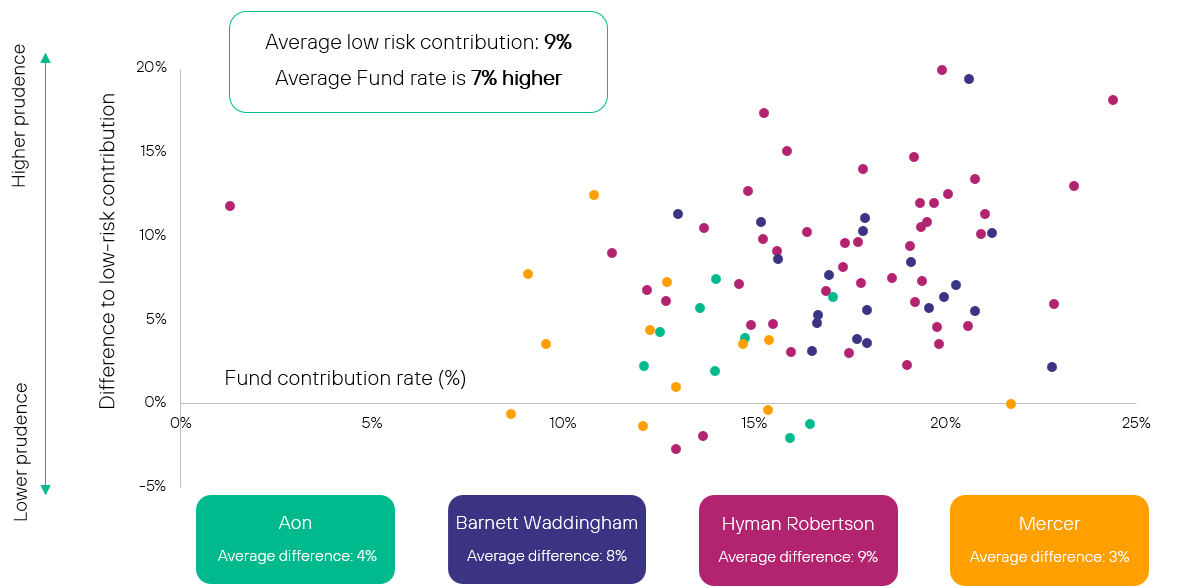
Source: Isio analysis based on the 86 funds in the LGPS (E&W). We have excluded the Environment Agency closed Fund. Averages included are weighted by the Fund’s payroll.
The charts highlight the significant level of prudence being taken by the Funds with most setting rates higher than the low-risk contribution rate needed.
The average low-risk contribution rate across the group is 9%. This means Fund rates are on average 7% more than the low-risk benchmark measure.
There are 3 employers where the low-risk contribution rate is less than zero. This means the Funds are so well funded that the low-risk surplus can’t be used up even by reducing the contributions to zero for the next 20 years. In theory money could be refunded to employers whilst maintaining the low-risk level of funding. One Fund with a notable negative rate is Kensington and Chelsea. Illustrating that even though this Fund has dropped its average contribution rate to 1% it is still applying a significant level of prudence for the Fund overall.
Prudence Watch Score

The level of investment return above / below government bonds implied by the Fund’s contribution rate.
A lower score reflects higher prudence.
The Prudence Watch Score for each Fund considers the Fund’s contribution rate for the year from 1 April 2026 and estimates what level of investment return this implies to need that level of contributions. It then compares this level of return with ‘low-risk’ long dated government bond yields to give a Prudence Watch Score.
- If the Prudence Watch Score is zero, the Fund’s effective assumed investment returns are in line with the yield on long-dated government bonds
- If the Prudence Watch Score is negative, it means the Fund’s investments are assumed to perform less well than long-dated government bonds
Further details can be found in the Appendix.
Prudence Watch Score
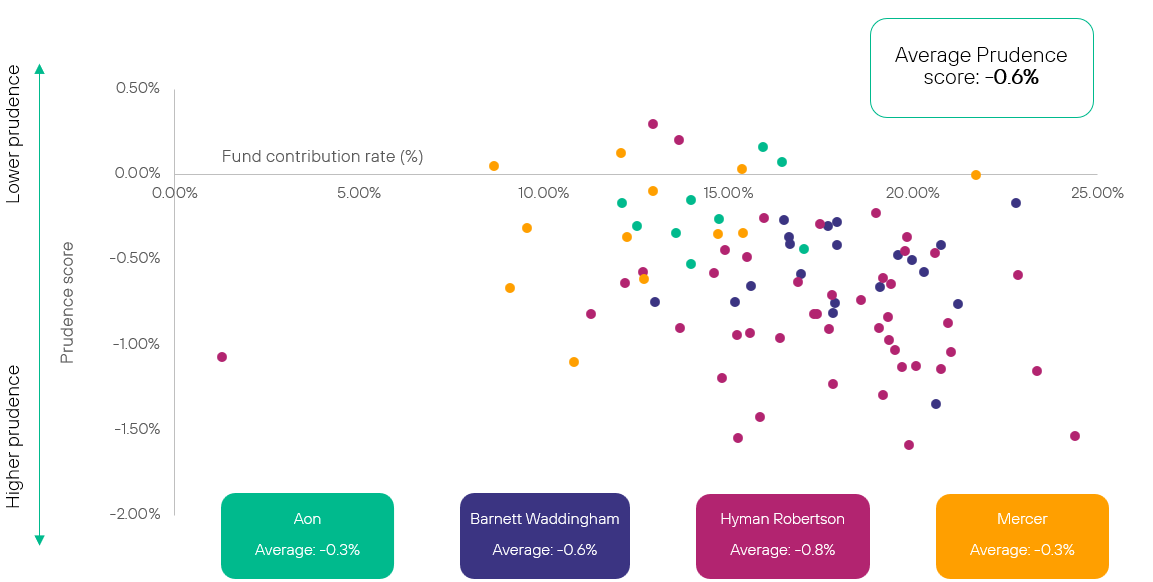
Source: Isio analysis based on the 86 funds in the LGPS (E&W). We have excluded the Environment Agency closed Fund. Averages included are weighted by the Fund’s payroll.
Find out where your Fund’s prudence sit in comparison to others:
Most Funds are assuming equivalent investment returns below government bond yields, which could be seen as a very cautious position given the long-term growth assets generally invested by the LGPS.
The average Prudence Watch Score across all Funds is -0.6%, showing Fund’s are assuming on average investment returns 0.6% below government bond yields.
Prudence Watch Score – Primary contribution rates
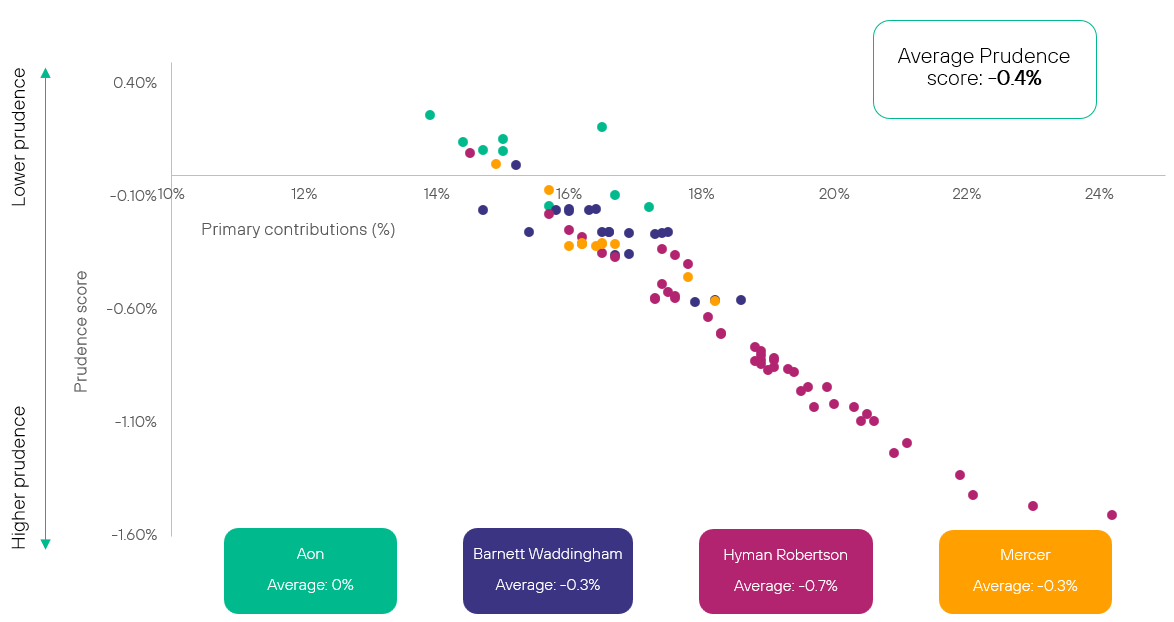
Source: Isio analysis based on the 86 funds in the LGPS (E&W). We have excluded the Environment Agency closed Fund. Averages included are weighted by the Fund’s payroll.
The picture on prudence looks slightly different when focusing only on Fund’s primary contribution rates.
Average Prudence Watch scores are lower reflecting that part of how Fund’s apply prudence is through how they allow employers to access surpluses.
There is also a clearer trend across the actuarial firms. Hymans Robertson advised Funds tend to set higher primary rates, whilst Aon advised Funds are at the lower end. However, as noted above Fund’s assumptions don’t reflect this trend, suggesting additional variations in prudence can be hidden within the Fund’s calculation approaches.
Prudence Watch Score – by low-risk funding level
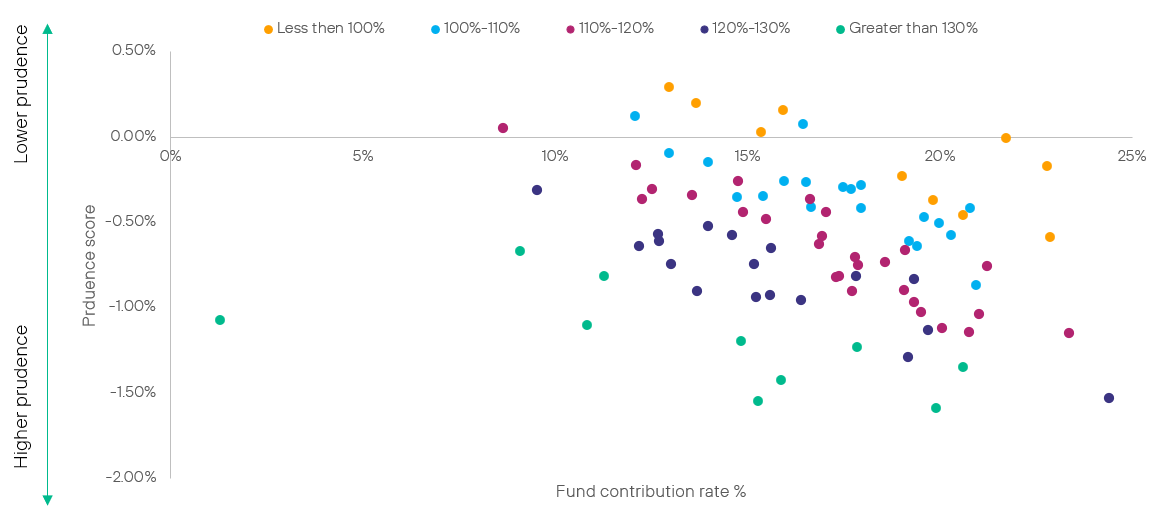
Source: Isio analysis based on the 86 funds in the LGPS (E&W). We have excluded the Environment Agency closed Fund.
The chart shows how Prudence Watch scores relate to the Fund’s funding level on Isio’s low-risk measure. Notably, the better funded Funds, with the biggest surpluses, have the most prudence applied. This illustrates the impact of stabilisation, limiting employers from being able to access these large surpluses to reduce contributions.
Postcode lottery
Prudence Watch Score – by location
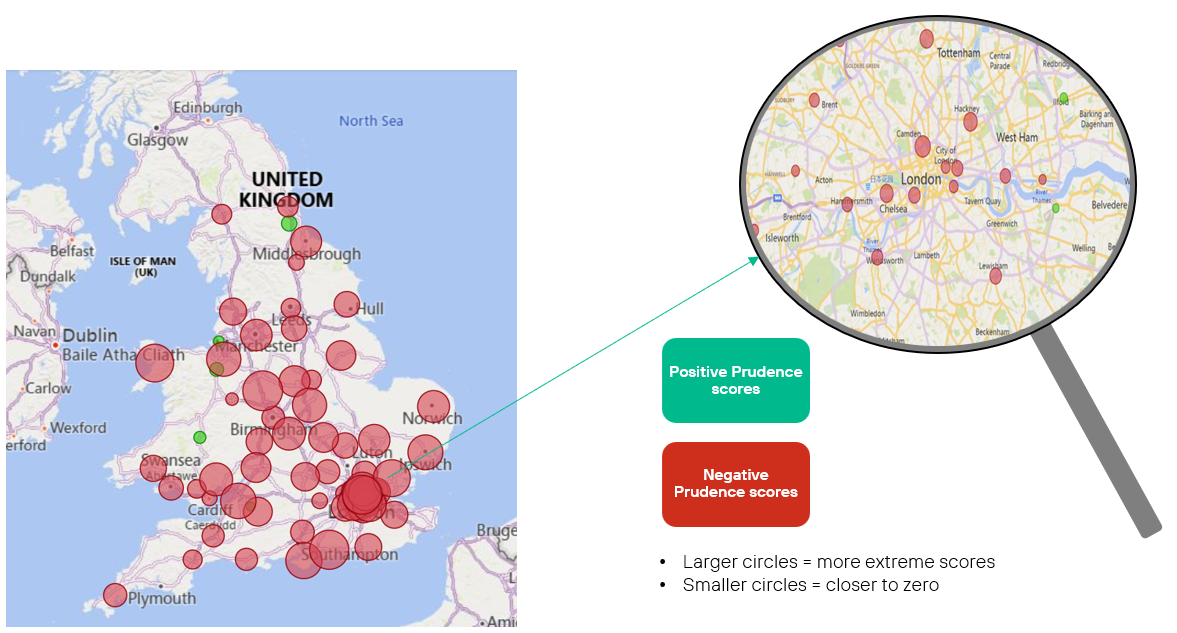
Source: Isio analysis based on the 86 funds in the LGPS (E&W). We have excluded the Environment Agency closed Fund.
Given the different approaches adopted by LGPS Funds for setting contribution rates, it can mean employers end up paying very different amounts depending on where they are. The map above shows the varying levels of prudence differing by location, with even neighbouring areas sometimes seeing big differences.
Isio has analysed the scores comparing different factors to location here. Each factor shows a similar lack of consistency, creating this uneven picture. Interestingly there remains variation across Funds in the same pool. It will be interesting to see if these differences reduce at future valuation cycles.
Please note that the numerical information set out within the results has been calculated using approximate methods, based on individual employer results and information available within the public domain (not necessarily the most recent), and has been provided for information purposes only. The information set out should not be considered as advice nor be relied upon in making any financial decisions. Further details can be found in the Appendix.
Get in touch
Discuss the Prudence Watch scores for your Fund.
Webinars
On demand: Necessary prudence or over-caution? Getting the right LGPS Valuation outcome
Explore these issues within the context of the LGPS finance and governance framework by watching the webinar on demand. Join Isio’s LGPS experts as they take you through an in‑depth discussion of the valuation and strategic options.
Watch on demand