LGPS Prudence Watch – March 2026 results
This is the second cut of data for our Prudence watch benchmarking. You can access the first cut at 5 February 2026, and learn more about Prudence Watch, here:
Employer contribution rates – 31 March 2026
The chart below shows the distribution of employer contribution rates from 1 April 2026 as a percentage of pay.
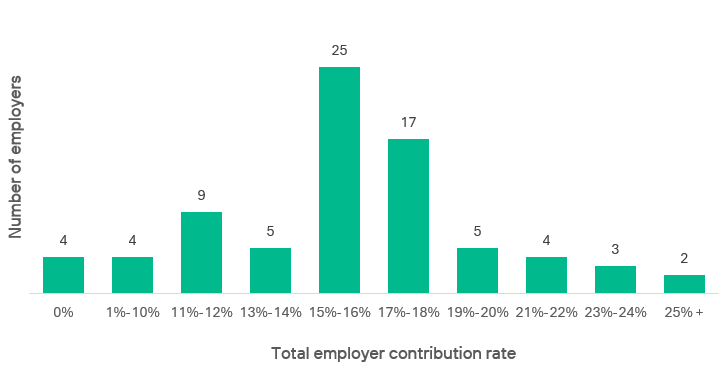
Source: Isio analysis based on 78 employers as at 31 March 2026
This shows a range of contributions with some being asked to pay nothing ranging up to a total contribution at the top end of 27%.
The average contribution rate for the sample is 16%, which is on average a 4% reduction from what they were paying at the last valuation.
Low -risk contribution rate
For each employer we estimate what their total contributions would be on a low-risk basis. We then look at how this compares to what they are being asked to pay. The difference illustrates the level of prudence within the proposed contribution approach which can be compared with other employers.
The low-risk contribution rate is estimated based on a ‘low-risk’ basis whereby the discount rate has been set with reference to long dated UK Government bond yields as a reference point to enable consistency across all LGPS funds. The total low-risk contribution rate reflects the cost of new benefits building up with an allowance for any low-risk surplus or deficit spread over 20 years used to reduce or increase contributions.
Further details can be found in the Appendix linked below.
For each employer the chart below shows the difference between the low-risk contribution rate and what they are being asked to pay.
Low-risk contributions – how do employers compare?
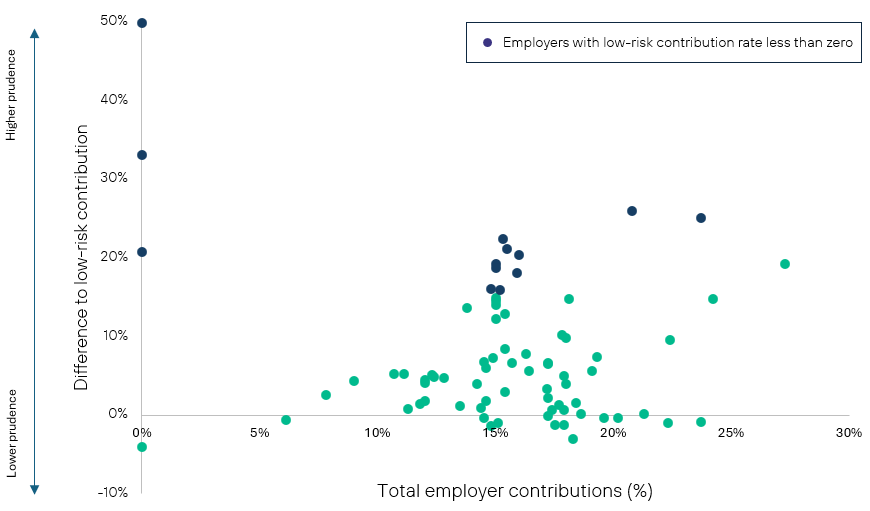
Source: Isio analysis based on 78 employers as at 31 March 2026
At 31 March 2026, the average low-risk contribution rate across the group is 11%.
This compares to the average employer rate of 16%, meaning employers are being asked to pay on average 5% more than their low-risk rate (excluding those noted below).
There are 15 employers where the low-risk contribution rate is less than zero (meaning that in theory money would need to be refunded to the employer). They have been highlighted in blue in the chart above. They tend to be employers with closed participations with trapped surplus. Given the specific circumstances of these employers we have not included these employers in the average rate shown above.
If they were included this brings the average low-risk contribution rate across the group to 6%, meaning on average a 10% difference from what they are being asked to pay.
Prudence score
The prudence score for each employer considers the proposed total employer contribution rate and estimates what level of investment return this implies to need that level of contributions. It then compares this level of return with ‘low-risk’ long dated government bond yields to give a prudence score.
- If the prudence score is zero, your effective assumed investment returns are in line with the yield on long-dated government bonds.
- If your score is negative, it means that your investments are assumed to perform less well than long-dated government bonds.
Further details can be found in the Appendix linked below.
Prudence score
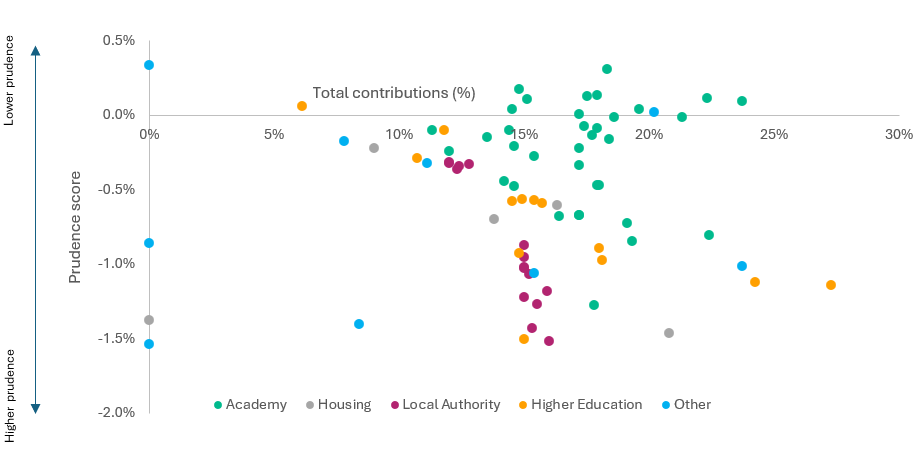
Source: Isio analysis based on 78 employers as at 31 March 2026
At 31 March 2026 the average prudence score is -0.6%, showing Fund’s are assuming on average investment returns 0.6% below government bond yields.
Please note that the numerical information set out within the results has been calculated using approximate methods, based on individual employer results and information available within the public domain (not necessarily the most recent), and has been provided for information purposes only. The information set out should not be considered as advice nor be relied upon in making any financial decisions. Further information is available in the Appendix linked below.
Get in touch
Add your valuation results to our benchmarking and see how your contributions compare.
Webinars
On demand: Necessary prudence or over-caution? Getting the right LGPS Valuation outcome
Explore these issues within the context of the LGPS finance and governance framework by watching the webinar on demand. Join Isio’s LGPS experts as they take you through an in‑depth discussion of the valuation and strategic options.
Watch on demandAppendix
This Appendix sets out further information on the data used and methodologies adopted in preparing Prudence Watch.
Data
The calculations are based on the employer valuation results reports shared with each employer by their Fund as well as publicly available information in the employer’s latest annual report and accounts.
Methodology
In calculating the Prudence measure a number of calculations are needed.
Standardised ‘low-risk’ funding position:
Based on the ongoing funding position shared in the employer results we calculate the employer’s funding position on a standardised low-risk basis:
The ‘low-risk’ funding basis adopted is based on the following assumptions:
- A discount rate used to value liabilities in line with fixed interest government bond yields at the valuation date 31 March 2025 (at an appropriate duration).
- Pension increases based on break-even Retail Price Inflation rates at the valuation date 31 March 2025 (at an appropriate duration) with an appropriate deduction for an inflation risk premium to reflect distortions in bond markets, and a deduction to reflect the differences in construction between Retail Price inflation, and Consumer Price Inflation (CPI) which drives pension increases in the LGPS.
- Salary increases are set based on an average premium relative to CPI as seen across LGPS funds for the 2025 valuation.
- The longevity and other demographic assumptions remain the same as those adopted by the Fund for the ongoing (or in some cases accounting) valuations as the impact of any difference between employer is considered less material.
- Duration information is taken from information included in the employers’ annual report and accounts.
- There are other views of what a “low-risk” basis may be. The basis we have adopted is used as an illustration of a set of assumptions where an investment strategy could be designed such that if fully funded there is a very low likelihood any future deficit would arise for past service liabilities. The aim is for a standardised approach across the Funds.
- Where fund-specific or employer-specific details are unavailable within the information received, reasonable assumptions have been made.
- The asset value remains in line with that used for the ongoing valuation results. For employers in Funds advised by Barnett Waddingham we note that assets values are smoothed over the six month period around the valuation date for the purpose of the ongoing valuation. This has generally led to an adjustment to the assets based on market value at the valuation date of around 2% and so we do not believe this will be material to the estimates shown.
Standardised ‘low-risk’ primary contribution rate:
A low-risk primary rate is calculated adopting the same low-risk basis outlined above.
- For Funds where Aon, Barnett Waddingham or Mercer are the scheme actuary, the calculation is based on the primary rate proposed from 1 April 2026 in the valuation results and this is switched onto the low-risk set of assumptions.
- For Funds where Hymans Robertson are the scheme actuary, given we are unable to replicate the approach used to calculate the primary contribution rate an alternative approach has been adopted. Here we take the service cost from the latest publicly available accounts as the starting point and switch this onto the low-risk set of assumptions.
Standardised ‘low-risk’ total primary contribution rate:
The total low-risk contribution rate is calculated as the low-risk primary rate plus any adjustment to allow for the low-risk surplus / deficit to be spread over 20 years.
Prudence score
The prudence score determines how much additional investment return is needed above the government bond yield used for the low-risk basis to replicate the total contribution rate requested by the Fund for that employer. It is the contribution rate for the year starting 1 April 2026 that is considered and doesn’t reflect how this may change over the three-year period.
To do this we calculate the adjusted funding position and adjusted primary rate from the low-risk positions calculated above to allow for this additional level of investment return in the discount rate assumption.
The level of additional return is then calculated such that the total contribution on this basis is in line with the total employer contribution rate requested. This reflects both the primary rate on this basis, plus any adjustment for the surplus/deficit on this basis spread over 20 years.
Reliances and limitations
The numerical information has been calculated using approximate methods and has been provided for information purposes only. It should not be considered as advice or be relied upon in making any financial decisions.
This work is compliant with the Technical Actuarial Standard TAS 100 published by the Financial Reporting Council, so far as their requirements are material for this.