LGPS (E&W) Low-Risk Funding Index: 31 March 2024 results
Pensions
Executive summary
- As at 31 March 2024, the estimated aggregate funding level for the LGPS (E&W) was 106% funded on a low-risk basis
- The aggregate funding level was 67% at 31 March 2022 and has remained at significantly higher levels since 31 May 2023
- The improvement in funding level is largely due to the significant increase in UK Government bond yields and improvements to asset values
- In line with releases since October 2023, the estimated funding levels for each of the participating 87 funds have been provided
- Of the 87 funds, 55 have funding levels greater than 100% and 32 have funding levels less than 100%
- The range of funding levels varies from 159% down to 68%
Introduction
This update sets out the latest low-risk funding position for the LGPS (E&W).
The estimates have been carried out as at 31 March 2024 and assume a ‘low-risk’ funding basis for the liabilities, i.e. the basis that would apply if assets were fully invested in liquid, low-risk investments, such as government bonds.
The aggregate funding position has been calculated by combining the individual results for each of the 87 pension funds participating within the LGPS (E&W). A summary of the individual results as at 31 March 2024 is set out within this update, along with comparative figures as at 31 March 2022.
Please note that the numerical information set out within the update has been calculated using approximate methods, based on information available within the public domain (not necessarily the most recent), and has been provided for information purposes only. We are using asset values and cashflow estimates as at 31 March 2022 until such time that all LGPS funds have published their 2023 annual reports. The information set out within this update. It should not be considered as advice or be relied upon in making any financial decisions. Further information is detailed in the Appendix linked below.
Background and purpose
Market conditions for pension schemes have improved significantly since the most recent LGPS (E&W) actuarial valuations were carried out as at 31 March 2022. The value of liabilities assessed with reference to gilt yields has fallen dramatically. This has led to material improvements in funding levels for funds and their employers, and indicates that funds should:
- Consider their funding and investment objectives in light of significantly improved funding levels (these may differ when levels are approaching or exceeding 100%)
- Actively review investment strategies, specifically considering whether de-risking opportunities should be taken advantage of
- Consider whether certified employer contributions should be reduced before 1 April 2026 to avoid overfunding
- Recognise the differing needs of their employer base and enable their participating employers to agree funding and investment arrangements that reduce current contribution rates and/or ongoing risk exposure
The purpose of providing this update is to:
- Highlight the very significant funding improvements experienced since 31 March 2022
- Provide a monthly update to track the evolving funding position and the impact of changes in market conditions since the launch of the Index and later reference points
- Monitor funds’ responses to these improved funding positions, considering investment strategy and employer engagement
Current market conditions are very good news for the LGPS and present an immediate opportunity to enhance long-term sustainability for funds and their employers.
Changes since previous release as at 31 January 2024
- Since 31 January 2024, the estimated aggregate funding level for the LGPS (E&W) has risen from 104% to 106%
- The rise in funding level is largely due to improvements in asset values, partially offset by a reduction in UK Government bond yields and higher inflation (both of which increase the value of liabilities)
- Our calculations have been updated to reflect the CPI linked increase of 6.7% applied to LGPS benefits from 1 April 2024
- 55 of the 87 funds have funding levels greater than 100%
- A comparison of the estimated aggregate asset and liability values as at 31 January 2024 and 31 March 2024 is set out in the chart below:

Aggregate results
We show below the change in funding level over the period from 31 March 2022 to 31 March 2024 for the LGPS (E&W) in aggregate.
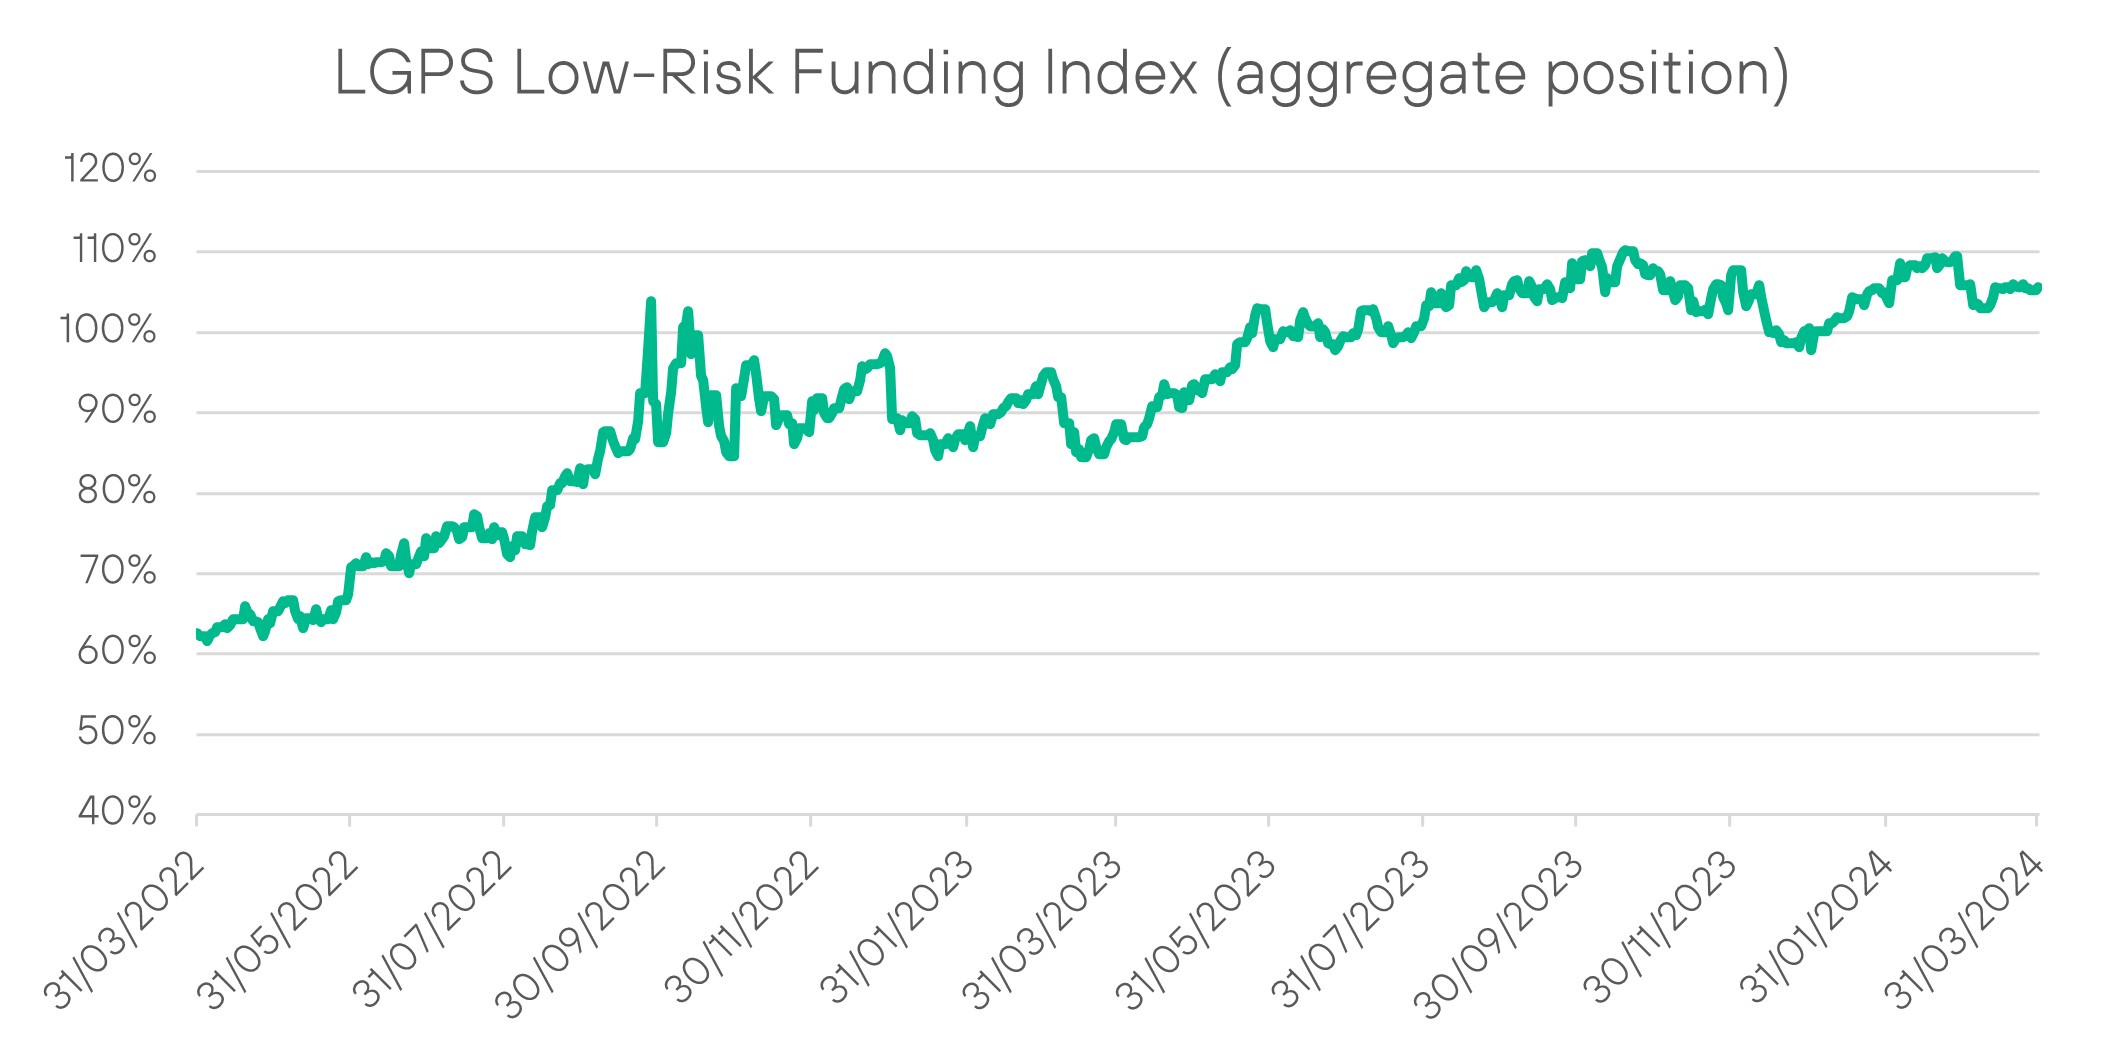
High-level commentary:
- The funding level for the LGPS (E&W) in aggregate as at 31 March 2022 was approximately 67% when calculating liabilities on a low-risk basis
- Over the period to 31 March 2024, the aggregate funding level has increased to 106%
- Significant volatility was experienced in September 2022 due to the release of the UK Government’s Mini-budget
- Since the Mini-budget, the aggregate funding level has remained consistently higher than as at 31 March 2022 (an average of 99%), allowing funds to reasonably consider the four points listed at the top of this update
Individual fund results
The table below details the change in funding level from 31 March 2022 to 31 March 2024 for all funds who participate within the LGPS (E&W). The chart also sets out the average funding levels at each of the two dates. The results have been provided on a named basis at the end of this update. Our calculations are based on asset values and cashflow estimates as at 31 March 2022 until such time that all LGPS funds have published their 2023 annual reports.
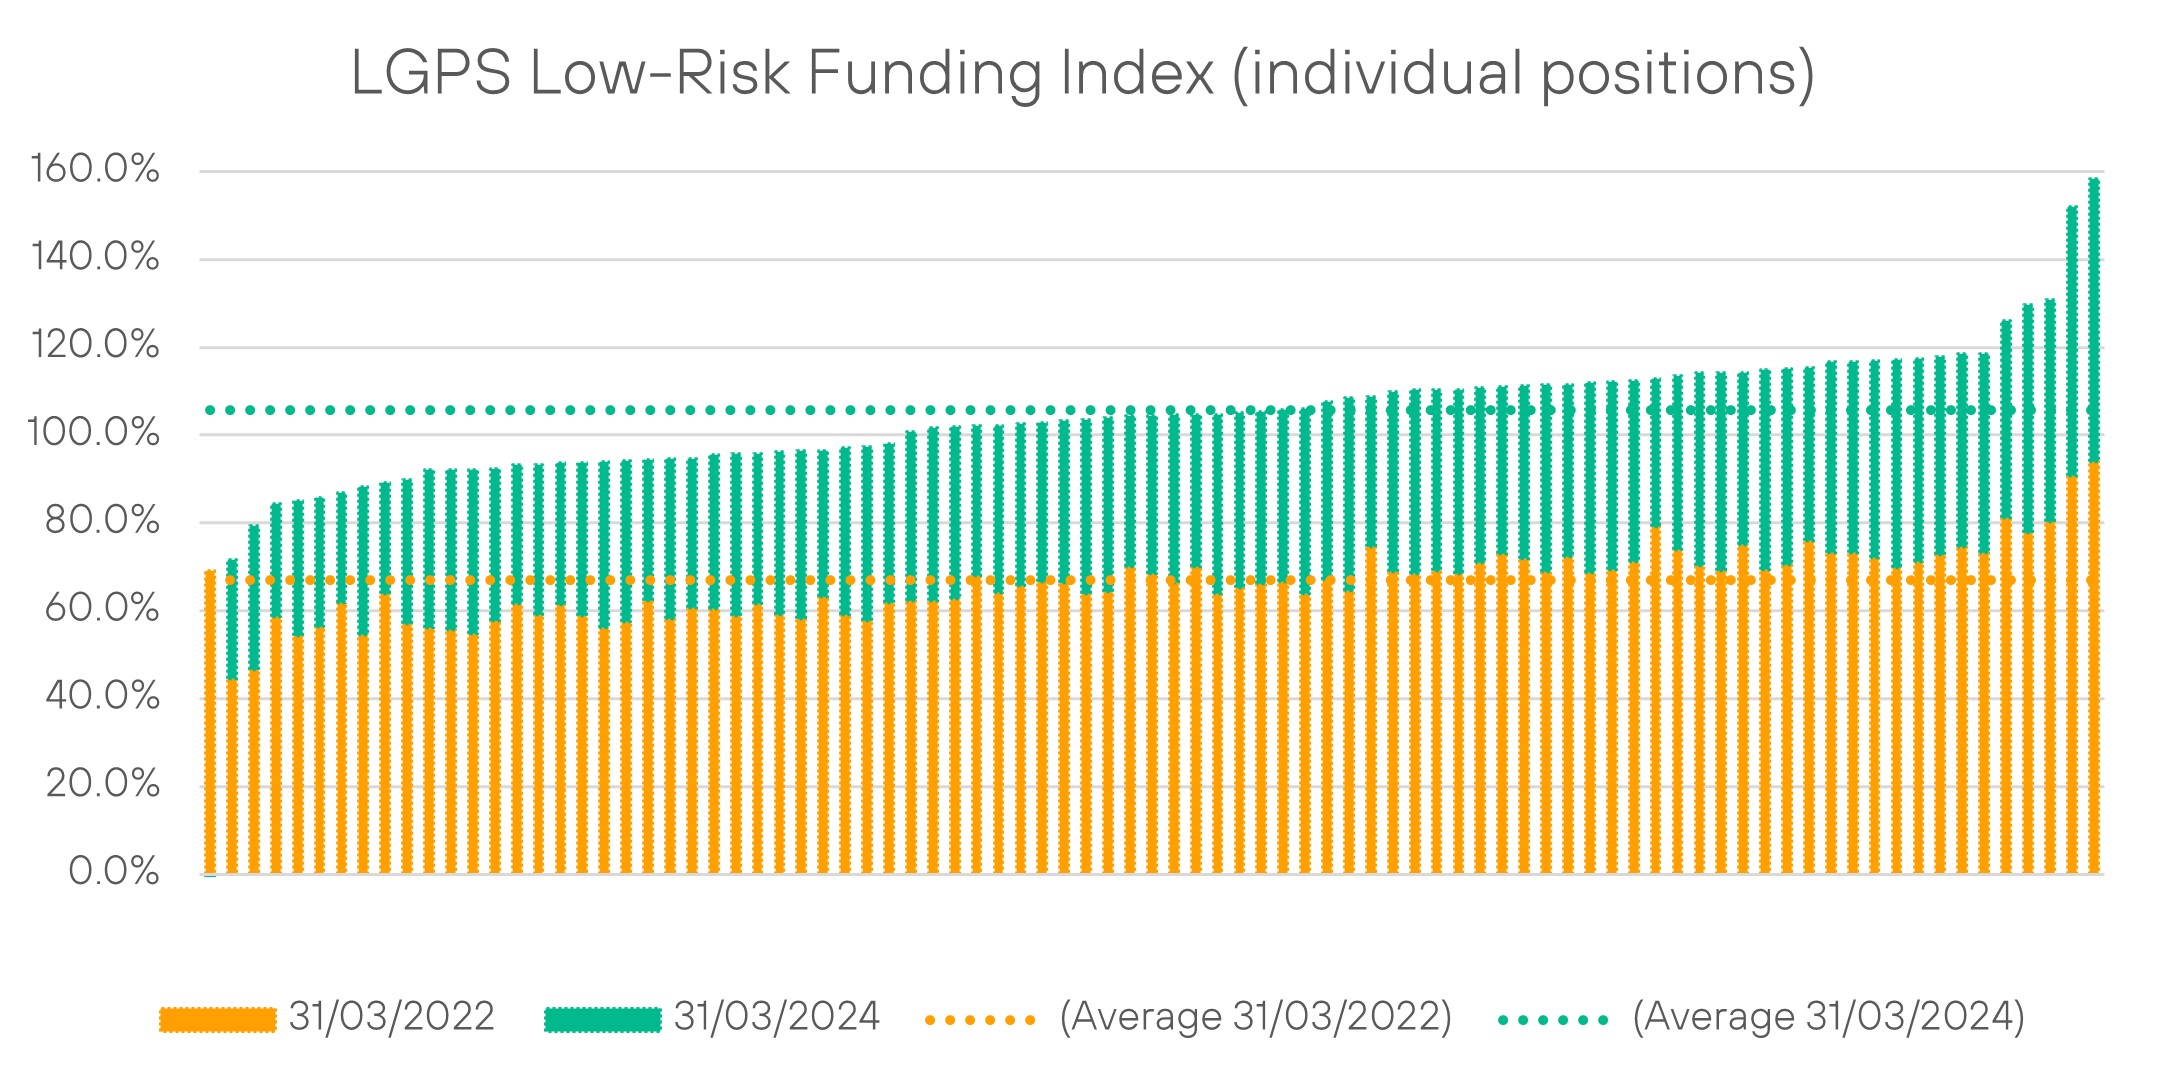
High-level commentary:
-
- 61 of the 87 funds reported a funding level of 100% or higher as part of the most recent LGPS (E&W) actuarial valuations that were carried out as at 31 March 2022. The liabilities associated with these results were calculated on each fund’s ‘ongoing’ basis
- Due to the market changes discussed earlier in this update, the reported funding levels are expected to have increased significantly over the period to 31 March 2024. Given the different approaches taken by each of the actuarial advisers to set each of the fund’s ‘ongoing’ basis, and the limited transparency, we are not able to quantify the size of the improvement
- None of the 87 funds had a funding level of 100% or higher as at 31 March 2022 when assessing the liabilities on a low-risk basis
- As at 31 March 2024, 55 of the funds have a funding level of 100% or higher on the low-risk basis
- Each fund’s funding level on the low-risk basis has increased by at least 25% over the period 31 March 2022 to 31 March 2024, apart from the Environment Agency (Closed) Pension Fund
- As mentioned above, significant improvements will also be made to funding levels on the ongoing basis, which is often used to set contribution rate levels for employers
Summary of individual fund results
As at 31 March 2024, on the low-risk basis:
- The three funds with the highest funding levels are: Kensington and Chelsea, West Sussex and Wandsworth
- The three funds with the lowest funding levels* are: Waltham Forest, Berkshire and Cornwall
*We have excluded the Environment Agency (Closed Fund) Pension Fund due to its specific circumstances (including the Government funding agreement) and bond-focussed investment strategy.
Main observations
- Trust-based pension schemes fully funded on a low-risk basis are, with very few exceptions, transitioning to lower risk investment strategies as quickly as possible
- De-risking does not have to be permanent and it does not need to apply to future service
- We expect DLUHC and the LGPS SAB to monitor these changes and consider whether more widespread action is required (e.g. an out of cycle actuarial valuation to prevent overfunding)
- We hope that funds will consider the 4 points listed at the top of this article and take effective action to accurately reflect the prolonged significant improvement in funding levels
Next steps
Overall, based on the sustained improvement in funding levels, we would expect to see funds consider:
- Shifting to lower risk investment strategies, for example through increased exposure to gilts and bonds;
- Reviewing current employer contribution rates, in particular, whether it might be appropriate to reduce current rates; and
- Offering de-risking opportunities and other flexibilities to employers
Engagement with funds
This update has been prepared using information available within the public domain (not necessarily the most recent) and our calculations are estimate in nature (see the Appendix for further information).
Since the launch we have not incorporated any new publicly available information or been provided with any new information by funds. In future releases we will do so and provide some commentary on the impact of this new information.
If you are a participating LGPS (E&W) fund and would like to speak to an Isio representative to discuss the information set out within this update or to provide more accurate and up-to-date information, please contact: steve.simkins@isio.com
| Individual fund results | ||
| Fund | 31 March 2022 | 31 March 2024 |
| Environment Agency – closed | 69.1% | 68.3% |
| Waltham Forest | 44.6% | 71.6% |
| Berkshire | 46.6% | 79.3% |
| Cornwall | 58.6% | 84.3% |
| Dorset | 54.4% | 85.0% |
| Avon | 56.5% | 85.8% |
| Clwyd | 61.9% | 86.8% |
| Brent | 54.5% | 88.3% |
| Powys | 63.9% | 89.1% |
| Hillingdon | 57.2% | 89.8% |
| Shropshire | 56.1% | 92.1% |
| Islington | 55.8% | 92.2% |
| Bedfordshire | 54.8% | 92.2% |
| Devon | 57.8% | 92.5% |
| Hounslow | 61.6% | 93.2% |
| Greenwich | 59.1% | 93.4% |
| Kent | 61.4% | 93.7% |
| Nottinghamshire | 58.9% | 93.8% |
| Barnet | 56.1% | 94.0% |
| Somerset | 57.6% | 94.2% |
| Merseyside | 62.4% | 94.4% |
| Havering | 58.2% | 94.5% |
| Durham | 60.7% | 94.6% |
| Greater Gwent (Torfaen) | 60.4% | 95.6% |
| Harrow | 58.8% | 95.9% |
| Redbridge | 61.6% | 95.9% |
| Newham | 59.0% | 96.3% |
| City of London Corporation | 58.2% | 96.5% |
| Enfield | 63.3% | 96.5% |
| Worcestershire | 59.2% | 97.2% |
| Ealing | 57.9% | 97.3% |
| Buckinghamshire | 61.8% | 98.1% |
| Cardiff | 62.3% | 100.8% |
| Surrey | 62.3% | 101.6% |
| Sutton | 62.7% | 101.9% |
| Cumbria | 68.0% | 102.1% |
| Leicestershire | 64.2% | 102.1% |
| Hackney | 65.8% | 102.7% |
| Hampshire | 66.7% | 102.9% |
| Lincolnshire | 66.4% | 103.2% |
| Barking and Dagenham | 63.9% | 103.4% |
| West Midlands | 64.4% | 104.0% |
| Merton | 70.0% | 104.4% |
| Derbyshire | 68.5% | 104.5% |
| Wiltshire | 66.4% | 104.6% |
| Bexley | 70.1% | 104.7% |
| Hammersmith and Fulham | 63.9% | 104.7% |
| Oxfordshire | 65.4% | 105.2% |
| Norfolk | 66.2% | 105.3% |
| West Yorkshire | 66.5% | 105.7% |
| Croydon | 63.8% | 106.0% |
| Dyfed | 67.1% | 107.7% |
| Swansea | 64.6% | 108.6% |
| Suffolk | 74.5% | 108.8% |
| Northamptonshire | 68.9% | 110.0% |
| Warwickshire | 68.4% | 110.3% |
| Lewisham | 69.0% | 110.3% |
| London Pensions Fund Authority | 68.4% | 110.4% |
| Lambeth | 71.1% | 110.8% |
| Hertfordshire | 72.9% | 111.1% |
| South Yorkshire | 71.9% | 111.4% |
| Lancashire | 68.9% | 111.5% |
| City of Westminster | 72.4% | 111.6% |
| Tyne and Wear | 68.7% | 111.9% |
| Rhondda Cynon Taf | 69.4% | 112.2% |
| Southwark | 71.3% | 112.4% |
| Cheshire | 79.2% | 112.9% |
| Greater Manchester | 73.8% | 113.5% |
| Haringey | 70.4% | 114.1% |
| Camden | 69.2% | 114.2% |
| North Yorkshire | 75.1% | 114.3% |
| Cambridgeshire | 69.4% | 114.9% |
| Kingston upon Thames | 70.5% | 115.1% |
| Essex | 75.9% | 115.4% |
| Staffordshire | 73.3% | 116.7% |
| East Riding | 73.3% | 116.7% |
| Tower Hamlets | 72.0% | 117.0% |
| Gloucestershire | 69.9% | 117.1% |
| Isle of Wight | 71.3% | 117.4% |
| Teesside | 72.8% | 117.9% |
| Bromley | 74.5% | 118.6% |
| East Sussex | 73.3% | 118.6% |
| Environment Agency – active | 81.2% | 126.1% |
| Gwynedd | 77.8% | 129.8% |
| Wandsworth | 80.3% | 130.8% |
| West Sussex | 90.8% | 152.1% |
| Kensington and Chelsea | 94.0% | 158.5% |
Reliances and limitations
The numerical information set out within the update has been calculated using approximate methods and has been provided for information purposes only, it should not be considered as advice or be relied upon in making any financial decisions.
This work is compliant with the Technical Actuarial Standard TAS 100 published by the Financial Reporting Council, so far as their requirements are material for this.
Contact details
If you would like to speak to an Isio representative to discuss the information set out within this update, please contact: steve.simkins@isio.com.
Get in touch
Talk to us today to see how our bolder thinking can get you better results.